
Behind the drama of the final day of the French football season with Canal+ and Stats Perform
 As the Ligue 1 season in France came to a dramatic close, Canal+ enhanced its final day broadcast coverage by providing viewers with predictions of the likely winners and losers in the title race, using insights powered by Stats Perform’s Qwinn.
Those insights included predicting match outcomes with Live Win Probability and predicting the title outcome with Qwinn Season Simulation.
Here Matthieu Lille-Palette, vice president sales, Stats Perform, talks about using data to enhance the fan experience and delivering ever deeper insights.
What do AI and machine learning with Qwinn add to the fan experience in live sports?
Powered by Stats Perform’s Opta data, the world’s richest global football dataset, Qwinn processes historical player and team performance outputs to generate predictive insights in relation to likely outcomes before a game takes place, as well as the impact of in-game events on the overall probability of a team winning.
These insights are changing the way broadcasters and publishers frame key narratives with its audience, both in terms of key talking points pre-match and the significance of key moments on the pitch, which they can communicate on screen during live broadcasts and through social feeds, enriching a fan’s second screen engagement.
When was Qwinn launched and how has it developed since?
Stats Perform has invested in AI and advanced analytics for an extended period of time. For example, our Expected Goals model, which has been a staple of the BBC’s Match of the Day coverage since 2017, was first developed five years previously and has been adopted by professional teams to help better understand the quality of chances they were creating.
Since launching Expected Goals, Stats Perform has developed a number of other models adopted by broadcasters, including a Possessions and Sequence framework, which are providing fans with brand new insights never seen before.
Ahead of the next European season, further predictive Qwinn insights will become available, including changes to the momentum of both teams during a game, as well as insights into how results impact on where a team will likely finish in a projected league table.
How did you start working with Canal+? What’s the background to that relationship that got you to this game?
We have enjoyed a long-standing relationship with Canal+ dating back a number of years and, as this year’s Ligue 1 campaign was reaching its climax, it was becoming clear that the title winner was not going to be decided until the final day of the season.
Taking into account the potential drama of that final day, with goals at the matches involving the contenders, Lille and Paris Saint-Germain, changing the likely destination of the title, we introduced the broadcaster to a couple of new Qwinn models which we felt would help them tell the story of the final day in real time, informing the audience who was most likely to finish the day as Ligue 1 champions based on how each game was playing out.
What were fans given on the day and how did Canal+ use it for viewers?
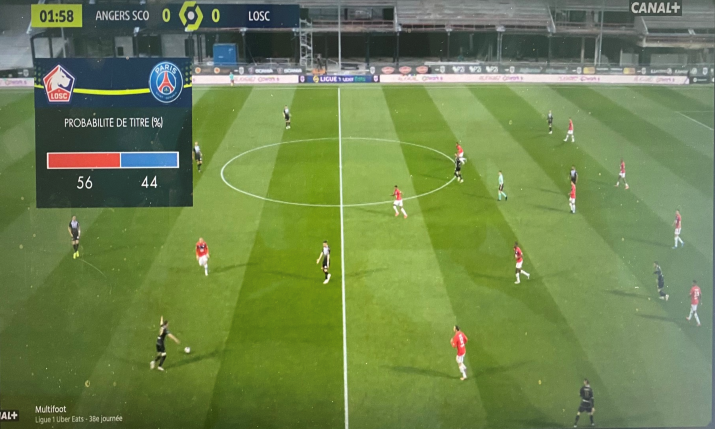
During Canal+’s pre-game preview show, the Qwinn Live Win Probability model was presented via on-screen graphics to highlight the likely outcome of both matches involving the title rivals. Alongside this model, outcomes of Qwinn’s Season Simulation were also displayed to highlight the probability of both clubs finishing the season on top.
In addition to providing pre-match insights, Canal+ also used the models as the matches were taking place, to explain how goals scored in each game were influencing the outcome of the title race.
To help educate its audience on how the probability models worked, Canal+ displayed a brief explainer summary on screen, outlining how the probability models are calculated.
What was the result?
Canal+ producers monitored changes to the Qwinn Live Win Probability from Stats Perform’s PressBox Live tool, which provides a full suite of data-powered insights to fuel a broadcaster’s in-game narratives.
At appropriate times in the match, on screen widgets were used to highlight which of the two teams were most likely to win the title, based on the current scorelines and on calculations from Season Simulation.
How will broadcasters be using this during the Euros?
These insights will be used across different outlets, both in broadcast and via online publishers, to initially identify the countries that are most likely to progress to the knockout stages and how every result of each group game impacts a team’s probability of progression.
This will be particularly engaging during the final match day of each group, as the probability of different teams progressing will fluctuate during the 90 minutes, as and when goals are scored and the match clock winds down. Displaying these changes to probability, both on screen via broadcast and social media, will only add to the drama as teams look to push for late goals and avoid elimination.
A team’s probability of winning the tournament outright will also constantly update as they progress through the competition, so once we reach the knockout stages publishers will be able to inform their audience of who is most likely to emerge victorious, based on who they face in their next game and their overall route to the final, delivering a compelling narrative powered by predictive data.