
F1: The inside track on the practice session Car Performance Scores graphics
As Formula 1 returned to TV screens over the weekend with the season-opening Austrian Grand Prix (3-5 July), TV viewers were offered additional on-screen graphics during the practice sessions, with data provided by Amazon Web Services (AWS).
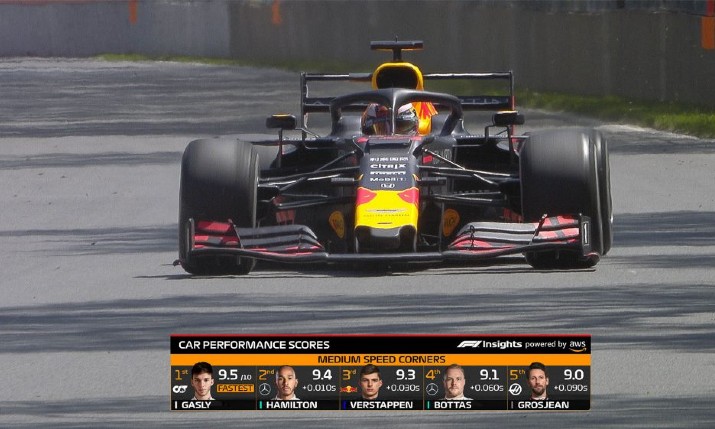
The first of six new F1 data sets was “Car Performance Scores” which isolates an individual car’s performance and allows race fans to compare its performance to that of other vehicles head-to-head.
The information was displayed as an on-screen graphic during practice, providing viewers with a breakdown of a car’s total performance using four core metrics: Low-Speed Cornering, High-Speed Cornering, Straight Line, and Car Handling. All factors were displayed as a score out of 10.
The graphics were then provided to rights-holding broadcasters via the world feed which was also shown on F1.tv
In a video interview on the official F1 website, F1 director of broadcast and media Dean Locke explained the purpose to the graphics and the scores being shown.
“The key,” he said, “was how can we represent more of the masses of information that the teams are looking at and get that to our viewers? We needed to make it easy to understand and represent what is going on in the practice sessions.
“We wanted to plot a graphic that opens up car performance to a wider audience and not just the engineers.”
“We had a lot of race graphics last year and actually now we’re looking at more of the practice sessions and getting behind some of the untold stories, certainly in the mid-field.”
To generate the graphics, live data is taken from 300 streaming sensors that are fitted to each F1 race car, which is then compared with 70 years of historical race data stored in Amazon Simple Storage Service (Amazon S3).
This combined stream is then sent to the cloud through Amazon Kinesis, a service for real-time data collection, processing, and analysis. F1 engineers and scientists then use machine learning (ML) models with Amazon SageMaker, AWS’s service for building, training, and deploying ML models. F1 analyses race performance metrics in real-time by deploying those ML models on AWS Lambda.
“[The graphics are] more suited to practice sessions,” continued Locke. “There are some great stories about how cars are getting better and why some cars are better suited to some tracks. It opens it up [to a wider audience]
As for displaying the information as a score out of ten, that is not just a quick way of illustrating each statistic, he added.
“It’s instantly recognisable. It’s a different way of reading it and we can also see if that score changes over a weekend or through the season.
“We had a lot of race graphics last year and actually now we’re looking at more of the practice sessions and getting behind some of the untold stories, certainly in the mid-field. More practice session graphics will come out throughout the season.”
To watch the full interview visit: Formula 1 Car Performance Scores