
Formula 1 enhances live race coverage in vital first few seconds with new Start Analysis F1 Insight
Powered by AWS, Start Analysis shows those vital few seconds at the start of the race when drivers are going from a standstill to incredibly fast, up against their toughest rivals
Formula 1 debuted a brand new onscreen F1 Insight called Start Analysis at the 2021 Turkish Grand Prix held on 10 October 2021 at Istanbul Park in Tuzla, Istanbul.
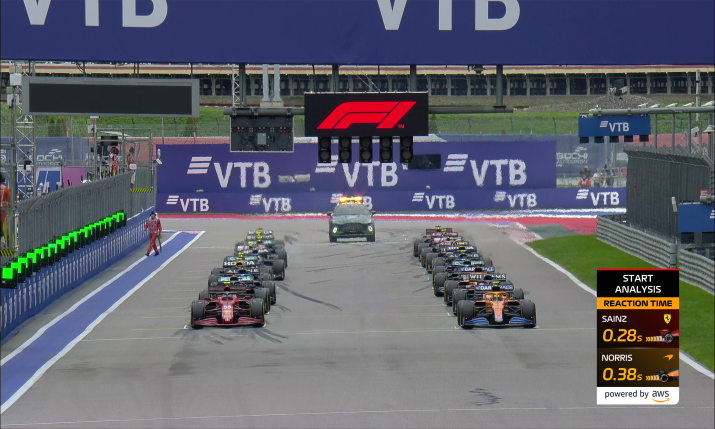
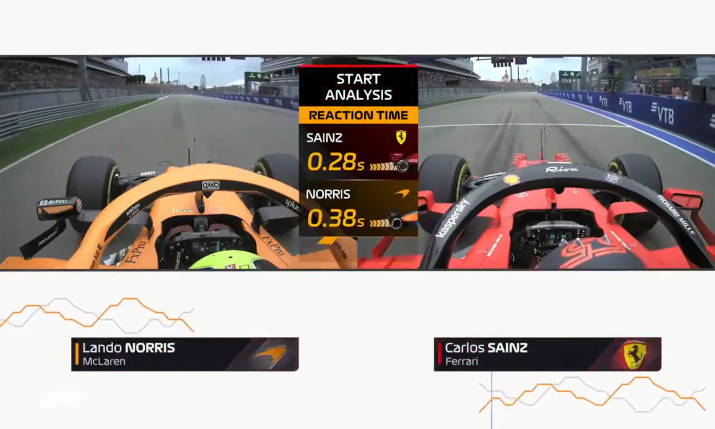
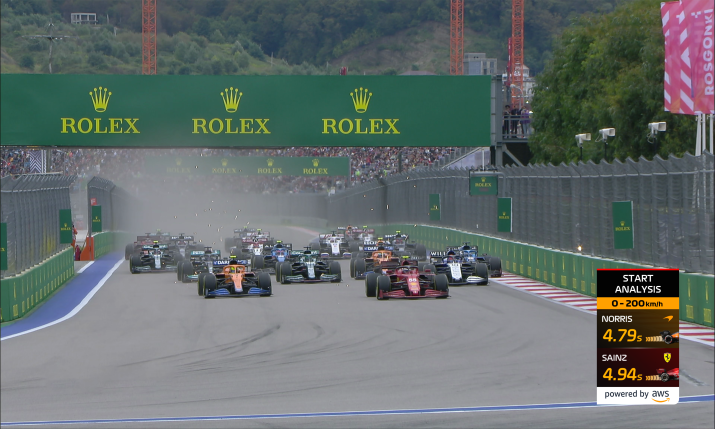
Powered by AWS, the new insight analyses those vital few seconds at the start of the race when drivers are going from a standstill to incredibly fast, up against their toughest rivals. The graphic shows which driver reacts the fastest, who controls the critical first phase with the throttle and clutch synchronisation, and who has the fastest overall launch up to 200 kilometres per hour.
F1 engineer, Rob Smedley, comments on why this stat is set to be a hit with F1 fans. “The start, or launch as it’s known within F1, is absolutely edge of the seat stuff for fans, drivers, and the engineers alike. It is one of the most exciting parts of a Grand Prix race and yet it’s all over and done within seconds.
“Given the importance of these initial few seconds of a Grand Prix race, the teams put a huge amount of effort into every detail. There are a number of precise and concurrent actions that the driver needs to carry out in harmony with the vehicle control system and power unit. This is by no means a simple task and requires, as is the norm in Formula 1, the optimal blend of both engineering and technical excellence and driving skills.”
“This is just the start. We need to build a statistical picture in different tracks and different conditions [using Start Analysis]. Only then will the trends emerge that will help the fans understand the launch at a deeper level”
Smedley goes on: “F1 and AWS have produced an F1 Insight graphic that unpacks another part of the Formula 1 weekend. We will be able to go back and really get under the skin of how each driver performed at all the crucial phases of the launch. I am looking forward to being able to show how these incredible athletes can react to the start lights going out. Prepare to be surprised by just how good they are.”
 Enhancing live coverage
Smedley comments on how the new stat was used by F1 and broadcasters at the weekend to enhance live coverage of the race: “We used Start Analysis powered by AWS to give an initial level of data as to how the start unfolds and how the drivers compare against each other.
“This is just the start,” he continues. “We need to build a statistical picture in different tracks and different conditions [using Start Analysis]. Only then will the trends emerge that will help the fans understand the launch at a deeper level.
“Over the past two years, Formula 1 has embraced AWS’s services to perform intense and dynamic data analysis,” he notes. “The F1 Insights we’re delivering together are bringing fans closer to the track than ever before, and unlocking previously untold stories and insights from behind the pit wall. [At the Turkish Grand Prix], broadcasters showcased graphics that gave an initial level of data as to how the start unfolds and how the drivers compare against each other.
“As with all F1 Insights powered by AWS, this is a tool to help the fan understand a particular element of this incredibly complex sport. Each and every insight plays its part in this journey and each one can be used at any particular moment in order to understand the scenario at a deeper level and therefore engage the fan to a deeper level than before,” he continues.
He gives an example where too little throttle in the initial getaway phase will result in the engine ‘bogging’ and the car pulling away at a slower acceleration than is optimum. “On the other hand, too much throttle and the rear wheels will spin excessively,” he notes. “In turn, this also effects the optimum acceleration, and the driver therefore must judge this to perfection. Another example would be the clutch drop phase, here the driver has to manage the clutch position from the moment the lights go out to the point that they have fully engaged it.
“There are a lot of things going on in a short amount of time and huge stakes at play. Imagine what the drivers and teams would give to qualify three places higher on the grid on a Saturday afternoon… A good start can give you exactly that effect. To understand the F1 launch we are introducing the next of the F1 Insights powered by AWS graphic; Start Analysis.”
 Exploiting performance for fans
The aim of Start Analysis is to give the fans at home a more detailed view of how each driver is able to exploit performance (or not) in the start or launch phase. The constituent parts of the graphic are:
- Reaction time – the time from when the start lights go out to when the driver reacts by dropping the hand clutch to the mid (semi engaged/semi slipping) position
- Initial acceleration phase – how the driver handles the wheelslip, the throttle position, fully releasing the clutch paddle to full engagement, and more
- How fast the car and driver are going in the latter part of the launch – using the slip stream, the overall drag of the car, holding position (making as few changes of direction as possible)
Smedley says: “If we take each of those elements, then it is possible to divide these into phases and graphically output each of these to see how one driver compares to another or what the overall rank is. The two parts of the latest graphic therefore are reaction time, 0-100kph to give an appraisal of the initial start phase performance and finally 0-200kph, which highlights the overall performance from the split second the car starts to move until 200kph.
“From these two parts that build the overall graphic we are able to see who reacts the fastest, who controls the critical first phase with the throttle and clutch synchronisation and who has the fastest overall launch up to 200kph,” he says.
Telemetry ready to be tapped
F1 cars are packed with telemetry ready to be tapped. In addition, F1 uses the timing data coming from the F1 system position around the track. The transponder (sensor on the cars), triggers the specific loop receiver when it passes it, telling it the specific car ID and the time of day down to 0.0001s. There are typically 25 timing loops placed around the circuit.
Smedley says the telemetry signals for a single car are synchronised to the clock (or time) within the electronic control unit (ECU). “If we take all 20 cars however, there is no single reference clock and therefore each car can have a slightly different time of day against an absolute reference given that they are not synchronised,” he explains. “It should be noted that usually within a team the two cars of that particular outfit will be manually synchronised in order that the analysts and engineers are able to carry out synchronous analysis of the intra team cars.
“The timing system is synchronised to the F1 start light system and therefore this gives us an absolute reference and synchronised time of day for all transponder events in terms of duration after the light went out at the start of the race.
“In the car telemetry, we also have signals that tells us when the car has ‘seen’ the loop transponder.”
Smedley continues: “If we fuse these elements together, we have a common event in both the car data set and in the timing data. This can then be used to sync the data sets for all the cars to the timing system and henceforth the moment the start lights went out and the race began.
“From the model we also calculate the distances between the cars themselves and between each car and a reference position in the track. This gives us an even deeper insight into start performance. In particular, we digitise the start-finish straight and we indicate using a colour code for what each car was doing during the various phases of the start. In order to calculate the cars position, we use GPS which gives us more granularity than the timing loops,” Smedley adds.