
Inside track: Uncovering the strategy behind Formula 1’s new graphic Insights for the 2021 season
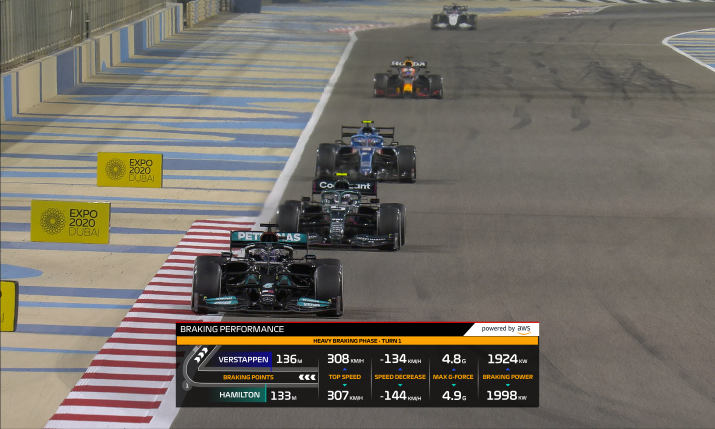
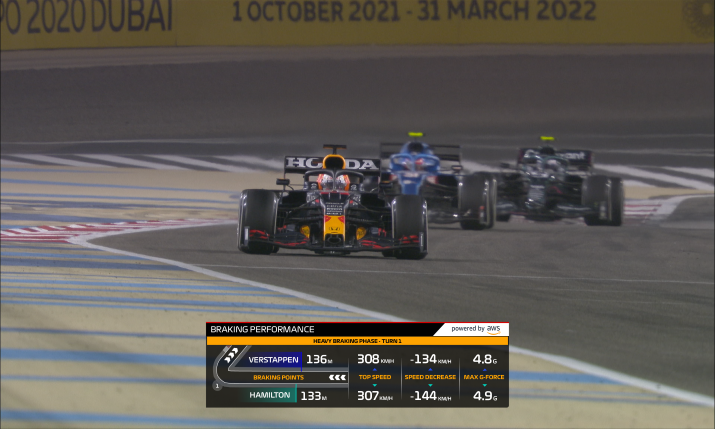
New F1 Insight Braking Performance displays and compares drivers’ braking styles and performance by measuring how closely they approach the apex of a corner before braking
Formula 1 has announced the release of the first of six real-time racing statistics for the 2021 season.
The first F1 Insight to be introduced this season, Braking Performance, shows how a driver’s braking style during a cornering manoeuvre can deliver an advantage coming out of the corner. It will be used as an on-screen graphic by broadcasters and on Formula 1’s social media channels this weekend for the Italian Grand Prix in Imola.
Each of the new F1 Insights, which will be rolled out throughout the 2021 Formula 1 season, are designed to give fans the inside view on split-second decisions made on the track before, during, and after each race by providing the data and analysis fans need to interpret driver and team race strategy and performance.
“If we can get the Gen Z’ers involved in Formula 1 by using data to tell those stories and give them insights and get them engaged in it, brilliant, then I’m all for it”
The new additions have been created in partnership between Formula 1 and Amazon Web Services (AWS). They build on six released in 2020 and a previous six released since the start of the F1 and AWS partnership in 2018, making a total of 18 F1 Insights delivered by the end of November 2021.
All of the insights will be integrated into the races’ international broadcast feeds around the globe, including F1’s digital platform, F1TV, helping fans to understand the split-second decisions and race strategies made by drivers or teams that can dramatically affect a race outcome.
Library of broadcast graphics
The idea behind F1 Insights is to give Deane Locke, F1’s director of broadcast and media, “effectively a library of graphics that he can call upon for any event,” says Rob Smedley, director of data systems at Formula 1, speaking with SVG Europe.
“When there’s an event [such as a crash or battle] coming up in the middle of a race that he wants to tell a story about, these offer a great way to be able to tell that story, through data,” he notes. “What we’ve always got to think about when we’re using data is how do we use it responsibly, first of all; how we’re using it to give insight.”

Rob Smedley, director of data systems at Formula 1
He elaborates: “Formula 1 races are incredible complex; if you imagine a football game, predominantly 85% of the action is always where the ball is. Formula 1 is very, very different because the director of the broadcast can only ever focus on one particular car pairing, or one particular battle, or one particular car.
“The reality is because there can be 20 cars on the track, there can be 20 interactions, 20 battles or events going on all around the track or in the pits,” Smedley continues. “Really it’s about teasing out that data to give the fans some insight as to what’s going on in something that they are watching and to give them more information than just the metadata that they’re taking in through the visuals, or to tell them something else which is emerging somewhere else. In some cases [it’s saying] “stay tuned” because something really great is going to come up here and here’s the data.”
He adds: “We can’t predict the future; we’re engineers and scientists, not magicians, but what we can do is say our simulations and algorithms we’ve developed with AWS [say] “this is what we think is going to happen”. That draws the fans in and gives [them] much more insight into what’s really happening right around the circuit.”
So many choices
More than 300 sensors on each race car generate over 1.1 million data points per second that F1 transmits from the cars to the pit and onto AWS for processing. F1 relies on the breadth and depth of AWS services to stream and analyse that flood of data as it is generated, and then present it in a meaningful way for TV and online viewers around the world through the F1 Insights.
Those six F1 Insights released last year were used across F1’s racing broadcast for each of the races on the World Feed, as well as on its digital channels since 2020. Says Smedley: “With AWS last year, what emerged was that the algorithms that we’re building, the models that we’re building are so complex [but] what usually gets onto the screen is a really simplified, elegant output. There’s so many different ways we can use this output that we started to collaborate with not just the live broadcast element of Formula 1 but also the digital platforms as well [to tell] more deeper data stories as well.”
That data is also being used on social media to attract different kinds of Formula 1 fans, outside of the hardcore regulars. Explains Smedley: “Across the F1 AWS partnership, we’re really cognisant of looking at how we can use all these data products to get these different fan groups involved in Formula 1. Younger fan groups might want to consume Formula 1 racing in five minutes, or 90 seconds or 60 seconds, across the various social media platforms. Data is a brilliant way of being able to do that; to condense stuff down into a format that is understandable, but condensed down into key moments of a two hour race. If we can get the Gen Z’ers involved in Formula 1 by using data to tell those stories and give them insights and get them engaged in it, brilliant, then I’m all for it.”
More than 300 sensors on each race car generate over 1.1 million data points per second that F1 transmits from the cars to the pit and onto AWS for processing
Bucket of ideas
To create the new insights, F1 uses historical race data stored in Amazon Simple Storage Service (Amazon S3) and combines it with live data streamed from F1 race cars and trackside sensors to AWS through Amazon Kinesis, a service for real time data collection, processing, and analysis. F1 engineers and scientists use this data to create machine learning models with Amazon SageMaker, AWS’s service that helps developers and data scientists build, train, and deploy machine learning models quickly in the cloud and at the edge.
“Formula 1 is this beautiful combination of man – and hopefully at some point, woman – and machine, so you’ve always got the machine question in there; how good is the driver really, because you’ve got this muddiness of the machine in the middle of it”
F1 is able to analyse race performance metrics in real time by deploying those machine learning models on AWS Lambda, which is a serverless compute service that can run code without the need to provision or manage servers.
To decide which stats to bring out next, Smedley explains the F1 team sits down with AWS to look at the three pillars the stats fit under: race strategy, “something that fans are always interested in,” notes Smedley; car performance, “using the car telemetry, which is really something that’s been almost hidden from the fans for many, many years,”; and competitor analysis.
The F1 and AWS team will come up with a, “bucket of ideas” at the beginning of a new season for potential F1 Insights, then will section those into the three pillars and bring in Locke’s team to get their thoughts. “They will be able to give us a really clear steer on the editorial value of the candidates, and by doing that, going round the various different stakeholders, we eventually get down to a list of six or seven. It’s very collaborative, I would say.”
Smedley says the F1 team works in an integrated way with the AWS team to develop F1 Insights. He says: “We’ve found a really good groove now between F1 and AWS in the way we work on these insights. First and foremost when we’re germinating ideas, we whiteboard it out between us, and I bring my knowledge of 25 years in this sport, AWS will bring their knowledge of technology and machine learning and cloud compute… it’s collaborative.”
For Smedley, Fastest Ever Driver, which was released in the middle of 2020, has so far been the best of the F1 Insights. He enthuses: “We used some really, really cool machine learning methods to build a neural network of [F1] drivers. You end up being able to ask the question, how fast was Senna compared to Hamilton? Formula 1 is this beautiful combination of man – and hopefully at some point, woman – and machine, so you’ve always got the machine question in there; how good is the driver really, because you’ve got this muddiness of the machine in the middle of it. So we worked with AWS to build some really cool machine learning algorithms that got rid the machine so you’ve just got the pure driver skill, even drivers from different ages. I think for me that was a really fun one.”
New season F1 Insights
On the new stat, when executed well, braking optimises a car’s speed through the phases of cornering and enables the driver to gain a better position on the track. Braking Performance displays and compares drivers’ braking styles and performance by measuring how closely they approach the apex of a corner before braking. In addition, it will show the key performance metrics that lead to how the car and driver perform together when cornering, such as top speed on approach, speed decrease through braking, the braking power (KWH) utilised, and the immense G-forces drivers undergo while cornering.
Braking Performance builds on the existing Corner Analysis statistic, which shows how cars physically perform while cornering.
The other five F1 Insights being delivered this season are:
Car Exploitation shows fans when F1 drivers are pushing their cars to performance limits in areas like tire traction, braking, acceleration, and manoeuvring during key points in a race. The stat reveals the data in real time by displaying a car’s current performance during a race compared to a theoretical performance limit, and then calculates the time gained or lost per lap as a result. The stat debuts on 11 to 13 June at the Canadian Gran Prix.
Energy Usage provides insights into how the high-tech engines powering F1 cars utilise energy during a race, including when teams unleash energy to overtake another car. The stat demonstrates energy flows through each component of the advanced F1 engine, known as the Power Unit, and shows how much battery energy is left at any given moment in a race. The F1 engine propels a vehicle by using a combination of internal combustion and hybrid systems that recover energy from braking and from the turbo charger. However, there are limits to the Power Unit’s energy storage capacity and the amount of energy that can move through it during each race lap. Race teams track this data to help maximise their car’s performance at key moments in a race, determining when to deploy energy in steady streams to achieve the best lap times or unleash it in focused moments to gain or maintain position when battling another driver. Energy Usage allows fans to see those decisions in real time. The stat debuts on 16 to 18 July at the British Grand Prix.
Start Analysis displays which driver was the quickest on the pedal and picked the perfect line, as well as which drivers struggled off the starting grid and why. Achieving the perfect start is a core driver skill, and Start Analysis will help fans understand how a driver’s decisions earn or sacrifice an early advantage in the race. The stat debuts 10 to 12 September at the Italian Grand Prix.
Pitlane Performance analyses pit stop performance, adding excitement to the portion of the race that takes place behind the pit wall. Pit stops are an essential and precisely coordinated, but time-draining element of an F1 race. Pitlane Performance offers insights beyond a car’s stationary stop time, like unpacking how the driver and team perform during each step of a pit stop in the pitlane and highlighting total pitlane time lost or gained due to how efficiently the team works. The stat debuts 8 to 10 October at the Japanese Grand Prix.
Undercut Threat helps fans anticipate which cars are at risk of being overtaken as the result of an undercut. The undercut is an F1 race strategy where a chasing driver enters the pit for fresh tires with the expectation that improved lap time resulting from the new tires will allow the driver to overtake the car in front once that car has pitted. F1 introduced a similar stat, Pit Strategy Battle, in June 2020 to highlight an undercut battle as it happens and help fans assess in real time how successful each driver’s strategy will be. Undercut Threat adds a new layer of predictive insight by analysing race performance before either car has pitted, adding to fan excitement and the sense of jeopardy around potential action to come. It visualises data on gaps between cars, average pit loss time, and tire performance to help identify which cars are at risk. The stat debuts 19 to 21 November at the Australian Grand Prix.
“Data has become a critical piece of the story for modern sports, and for F1 – where literally each second on the track produces more than a million data points – they require a partner that can translate that raw data into meaning in real time. AWS enables F1 to analyse its troves of data at scale, make better and more informed decisions, and bring fans closer to every phase of action on the track, from the starting grid, to cornering, to pitting,” said Darren Mowry, director of business development at AWS EMEA. “The world’s premier sports organisations are using AWS to build data-driven solutions and reinvent the way sports are watched, played, and managed. Our work with F1 demonstrates how advanced stats can elevate the fan experience by revealing the tactics and strategies behind even the most seemingly straightforward elements of a race.”
Check out Braking Performance’s debut on screen at the Grand Prix in Italy on 16 to 18 April 2021