

SportTech 2016: Virtual graphics, player tracking and the power of Big Data
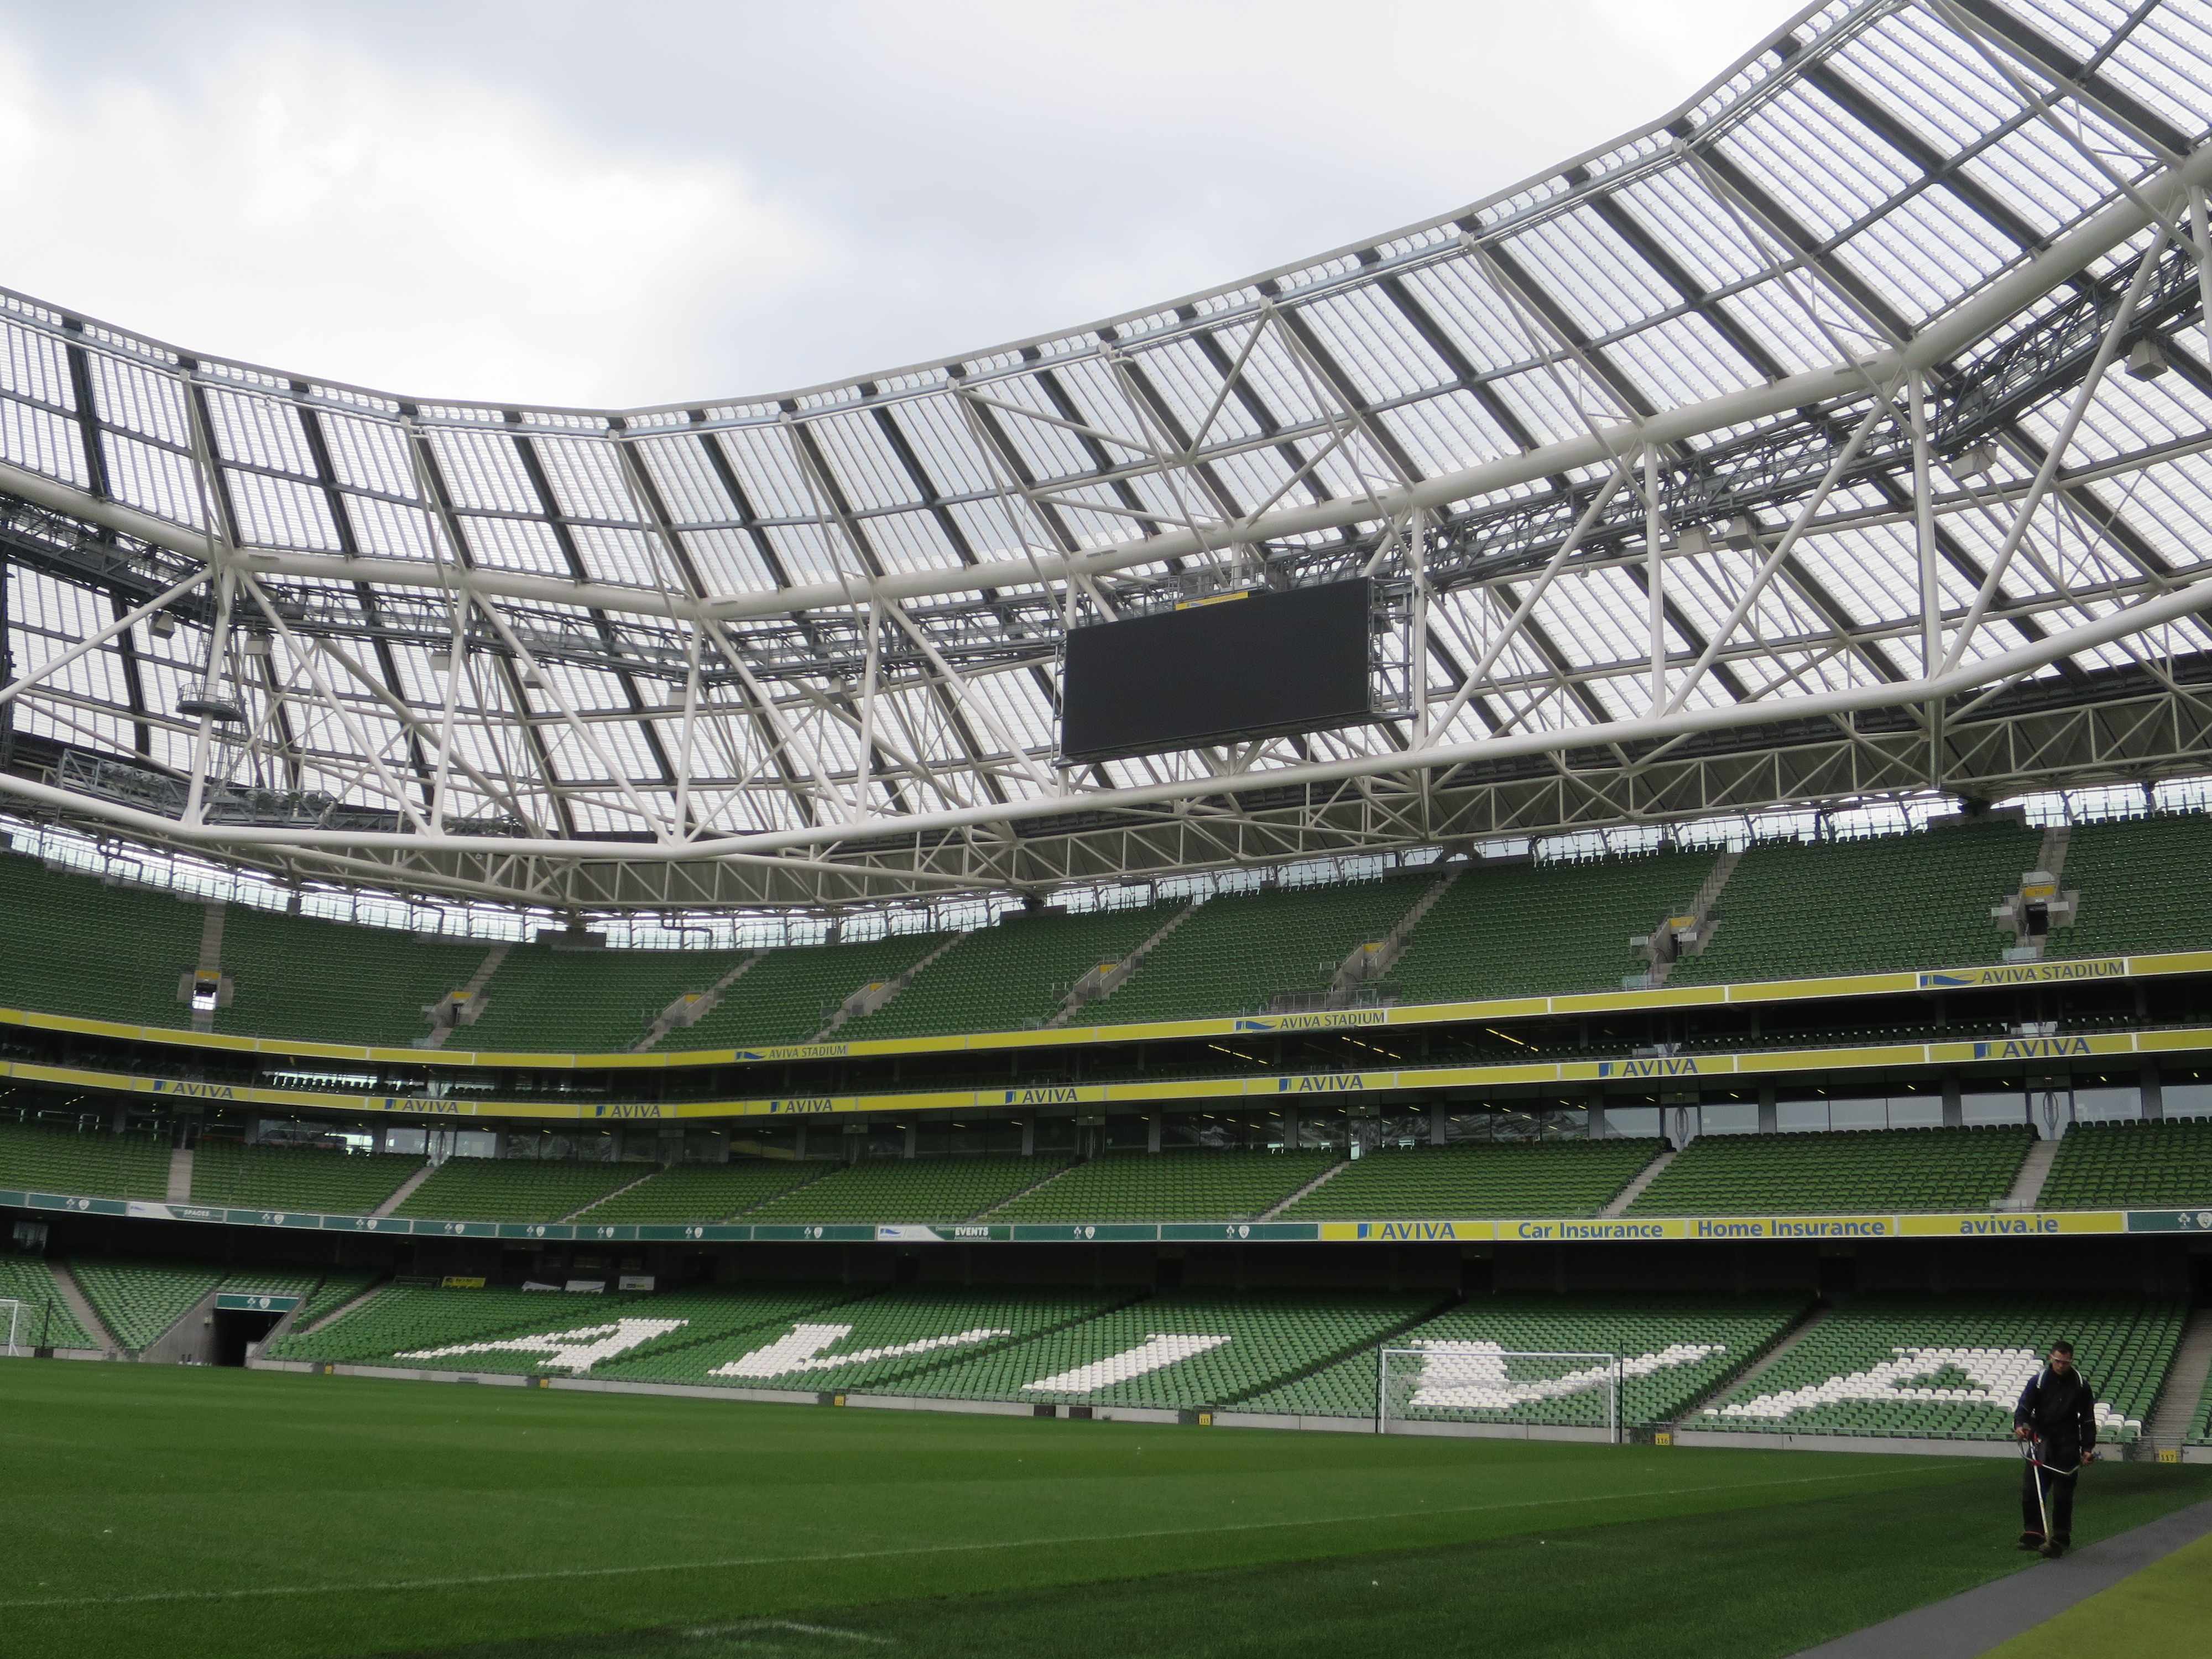 “There is an obvious hunger among viewers and sports fans for more data and more analysis,” Oliver Parker, Regional Sales Manager, ChyronHego said at the recent SportTech 2016 in Dublin’s Aviva Stadium. “We’ve seen that with the success of Gary Neville on Monday Night Football. People watching sport at home want more information and more analysis and more statistics, and virtual graphics is the perfect way to bring that in, because the alternative is to put out more normal information graphics, and then they are just sat reading stuff off the screen, which isn’t perfect. When you are looking at virtual it allows you to take that data in context,” whether it is in the studio or stadium, and you are contextualising it with the talent walking around it. “It’s a much nicer way for viewers to receive information than just statistics on a page.”
“It’s really about storytelling,” said Vincent Noyer, Acting Head of Ericsson’s Piero Business Unit. “Every client has different editorial lines.” Some producers will want to cover the referee point of view, because of previous controversial decisions; others have particular players as guest, which will skew their view another way.
“That orientates the directions we’ll take on the graphical package,” he added. “We’re here to convey the message in a more TV friendly way than just putting: ‘Possession 44%’. That doesn’t really mean anything if you are playing counter attack. You can show these things in a more engaging way. Data for the sake of data is not interesting.” The raison d’être for these systems is that “they help broadcasters to put the message out in a meaningful way.”
Of course, you have to avoid “adding graphics for the sake of graphics,” said Lindsay Hughes, Sales Manager, RT Software, but “it is now becoming the norm to have virtual analysis, virtual graphics on major sports broadcasts,” added Tony Page, Head of Onstage (Graphics and Data Services) at deltatre. “Every sports broadcaster we talk to wants to improve and evolve. […] It’s almost like an arms race,” and “using data to power those kind of solutions is the way forward.”
Can you have too much data?
“The biggest area of growth and interest [for ChyronHego] is around the data and how we can use the data,” said Parker. “As a data provider, we started on the Premier League about three years ago, the same time that Sky started doing the live player visualisations on the live feed, but it has taken a long time after that to mature,” partly “because no one really knew what to do with it,” he added.
The company provides “a massive stream of live positional data” through Opta and “it has taken a while for people to start to analyse that properly.” The clubs already have large sports science and analysis teams, and ChyronHego has been working with them to make the data mean something, but that is something broadcasters are only now becoming involved with.
There is a lot of raw data available, such as player’s acceleration, but “someone’s speed is only relevant when you know what the ball is doing, or what someone on the opposing team is doing with the ball,” explained Parker. “Once you’ve got that, you’ve still got to make it relevant to the broadcast.”
Live positional data generate huge files. “It can be quite difficult to translate those on air as a graphic,” particularly if you want to do more than just replay the action in 3D graphics — in which case why not just watch the action, said Vincent Noyer, Acting Head of Ericsson’s Piero Business Unit.
The biggest issue BT Sport has is data handling. Besides the huge file sizes, “how do we read and store that data?”, asked Daragh Bass, BT Sport, Innovation Producer, from the floor. It is not merely a matter of producing graphics from the data, but being able to dive into it to decide what graphics will best illustrate it.
“It is a challenge,” agreed Page. “So much data is generated around events, and one of the things we do try to do is to provide tools where you can try to filter that data, and use it to assist you, so you can find an event in the EVS and go and pull out the clips that you need, and you are then ready to do your analysis or telestration on it. The filtering part is key, but once you crack that it opens up a lot of opportunities, not only to use data for on-screen graphics, but also as a research tool and workflow helper.”
Noyer would like to see an open standard for data, to simplify comparing data sets (such as from different leagues). ChyronHego certainly had to do a lot of work when it started with positional data in translating previous manually gathered data in to something relevant and usable with its new data. Parker doesn’t think it is particularly to do with open standards, because it is just a data stream, however: “The values that you are taking have got to line up somewhere.”
On budget
 One of the problems Olivier Emery, Co-Founder of Trimaran, sees facing the industry is that virtual graphics “is the first to be cut” if there are any budget constraints, as Trimaran has found out for its rallying coverage in France recently. “We need to find a way to simplify a lot of our tools to reduce the cost. The cost is mainly, of course, development, but then mainly the operators.” Using GPS data live is more complicated than it seems, with RF transmission from the rally cars introducing delays, so it needs someone to mould and clean the data, and produce the graphics. Currently it needs three people to manage that live, “and we need to do that next year with two persons.”
Page agreed that virtual graphics are an obvious target for cuts, “but it’s become the norm. People at home expect to see that virtual graphics style, augmented reality, virtual analysis tools, so I think the key is how to reduce the cost of providing the service. Do you use one box to produce the augmented reality and on-screen graphics? Are there more simple ways to set up so you don’t have to be on site days before? That’s where the challenge is now to start reducing the cost, because the viewer at home does expect to see that kind of service.”
He believes that data can streamline graphics workflows. “If you’ve got that player tracking data then you can do the virtual visualisations a lot quicker, because straight away you know the positions of the players on the pitch. It doesn’t take a long time to produce clips [but] you still only have a finite amount of time to use them in the broadcast. Any clips that you have created, and don’t use, you can push out on digital platforms as well.” Getting more coverage from your investment “is the way forward,” said Page.
Where next?
Looking ahead to upcoming events, Hughes believes “we are going to see a lot more virtual advertising – on whatever surface that might be.” RT is getting a lot of interest in this from broadcasters and technology companies.
“Delivering to mobile and web is really important,” said Parker. “You can have all of this information, but you still have someone sitting at home who just wants to watch the game,” so it is important to be able to put any additional layers of information onto other devices, so that viewers can call up data on their iPad if they want to, without risking missing any live action.
Sixty merges OTT with broadcast graphics on multiple devices, allowing users to customise the graphics and interact with all the data that is available for the event on their own device. “If you don’t touch it, it will behave like normal TV,” explained Kjetil Horneland, Sixty’s CEO, but the system offers more choice through an interactive layer on top of the broadcast production. “It should provide a more interesting end user experience, and it also is a way of being able to influence how the viewers are watching your stuff,” he added.
Given that “one commentator’s opinion is very different from another’s, you’ve got to be careful with trying to telestrate on the live. On the second screen the viewer can track their own player,” said Page.
“We have the ability to telestrate live,” added Parker, “but it’s meaningless because you could circle somebody just when he stops to tie his shoelace, so giving people the ability to view that off the main output is going to be more powerful.”
It is also difficult to use virtual graphics full screen, because the director wants to keep the live action on screen. “You need to find a way to put the data on the live. You have the standard system, using the overlay, but the new way to put all this data on the screen will be the augmented reality,” said Emery. “A lot of graphic companies are working on that,” and he thinks it will make a big breakthrough in 2017.