

Bundesliga Match Facts enhanced with three more real time statistics from AWS
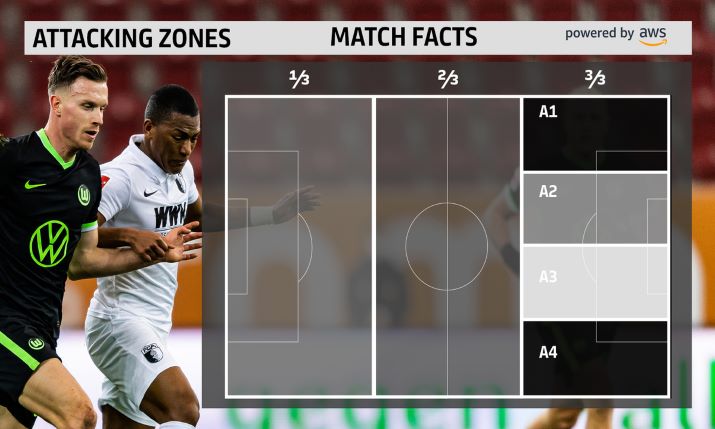
Bundesliga’s new Match Fact, Attacking Zones, from AWS
Deutsche Fußball Liga (DFL) has begun using three new Match Facts powered by Amazon Web Services (AWS), adding to four released last year.
At the beginning of last year DFL and AWS began working together on several areas, including data analysis. As part of this partnership, they have stepped up efforts involving the live processing of data regarding statistics. This has resulted in the Bundesliga Match Facts powered by AWS.
Those statistics are available to media partners, fans and the general public as well as the clubs themselves during match broadcasts and online. Three new statistics have been added this year: Attacking Zones, Most Pressed Player and Average Positions: Trends.
Attacking Zones visualises the areas in which the teams push forward into the box. This involves splitting the last third of the pitch leading up to the opposing team’s goal into four equally sized vertical zones. Any time players enter this third, the algorithm for the corresponding zone registers an attack. This can take the form of either dribbling or a pass. On-screen graphics show Bundesliga fans how each team’s attempts to press forward are distributed across the four attacking zones as percentages. Media partners now have the option to overlay attacking zones live on TV during matches. Fans can also use the Bundesliga app at any time to find out about teams’ preferred attacking zones in real time.
The Most Pressed Player stat rates the pressure on a player in possession and determines how often a particular player is put under significant pressure by the opposing team. Relevant variables in this calculation include the number of defending players as well as their distance and direction of movement relative to the player with the ball. If a particular threshold is reached, the machine learning algorithm registers a pressure situation for the player in possession. It is then possible to determine which players on a team are put under pressure especially often in relation to their teammates. While media partners can now show the Most Pressed Player in live broadcasts, fans can also use the Bundesliga app whenever they like to call up details of the pressure put on individual players, ranked by percentages, in real time.
While the Average Positions Bundesliga Match Fact, which shows where all players actually are positioned on the pitch on average, has been available since the 2019–20 season, the new Average Positions: Trends Match Fact, means this information can now also be visualised for selected sections of a match and compared. Media partners and commentators can choose for themselves which time spans to analyse and so make it easier to identify tactical trends, such as whether a team visibly reacts or begins a period of upping the pressure after a significant event such as a goal, red card or substitution. It is also possible to contrast the tactics of a team when it does and does not have the ball, or the real formations employed by the two teams during a particular phase of the match.
Audiences can see these ratings as TV graphics. Bundesliga app will soon also have the option to view real formation details customised to suit their own preferences.
Goal Probability and xGoals, Average Positions and the Speed Alert were introduced to Bundesliga Match Facts last year.
All Bundesliga Match Facts are integrated into the digital platforms and channels of the Bundesliga and international broadcasts. Media rights holders in German-speaking markets also have the option of incorporating them into their broadcasts.