

Tackling data: 2021 Six Nations Championship keeps viewers engaged with AWS Matchstats and Will Carling
 The 2021 Six Nations Championship kicked off last month with Italy and France facing off at the Stadio Olimpico in Rome on 6 February 2021. Now, several weeks into the tournament, fans are being entertained not only by the rugby, but also by Matchstats powered by Amazon Web Services (AWS).
New Matchstats for rugby were launched in 2020 during the global pandemic, adding to the seven that were made available in 2019. The new Matchstats were used either side of various lockdowns last year, and are being used right now to illustrate the game to the 2021 Six Nations Championship fans.
Watch Will Carling at SVG Europe’s Sports Graphics Spotlight on 5 March – register here
Will Carling OBE, former England rugby team captain and AWS Six Nations Ambassador, spoke to SVG Europe about how he sees these stats adding to the game for viewers.

Will Carling OBE, former England rugby team captain and AWS Six Nations Ambassador
“Before, it was [about] who made the most tackles, and suddenly we are now getting to the stage of actually [understanding] who made the crucial tackles; in sports that is the bit that makes it more interesting,” Carling notes.
Data is the new currency, he adds: “I look at my younger kids and they love data; they’re brought up on it. It gives them insight. Data makes heroes. They want to know who were the best and that all comes from who’s the biggest, the fastest, the strongest. And I think even for some of the older rugby fans, suddenly data gives them proof when they’re arguing their points in the pub.”
Real insight through data
In 2020 the Guinness Six Nations Championship worked with AWS to launch five new on-screen statistics to offer even deeper insights. Unfortunately the pandemic meant there was a seven-month break in the middle of the Six Nations last year, however, the stats ensured viewers stayed knowledgeable.
On how broadcasters can use Matchstats to increase their storytelling capability, Carling comments: “If I’m watching someone speak, you think that’s fine. But if you’ve suddenly got a visual as well, it’s a double whammy. It reinforces what they’re saying and you think, ‘right, I get that’. It gives them a bit of credence. Matchstats enable broadcasters to bring to life what’s happened in the game.
“In terms of what [broadcasters] might do more, I think rugby social media; it’s the aftermath. Little video clips, little snippets of data, match stats going out on social media channels; the game’s over, but people are debating it in pubs, they’re debating it the next day with their friends. These are crucial bits of data [that mean] you’re still in that conversation and still giving people a reason to talk about it,” he adds.
Adds Matt Hurst, head of sports marketing and communications at AWS: “TV broadcast commentators and pundits now have an easy and visual way to show and explain to fans the most critical moments in a game and where a match might be won or lost. The stats can help paint a picture of each match in accessible detail, during both half time and post-game analysis, making for an even more compelling viewing experience. Rich data and insights reveal the nuances of in-game decision making, and highlight performances through these advanced stats. Broadcasters are able to make the game much more accessible to new fans through the use of visuals, but also provide a deep dive into specific data around tackles and passes for those who are much more involved in the game.”
 In-depth technology
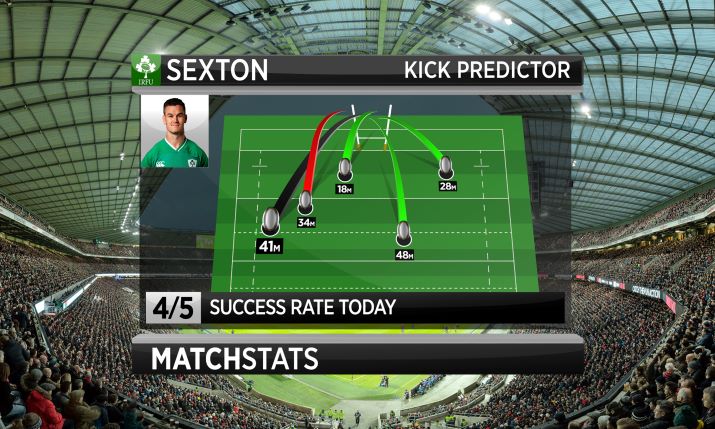
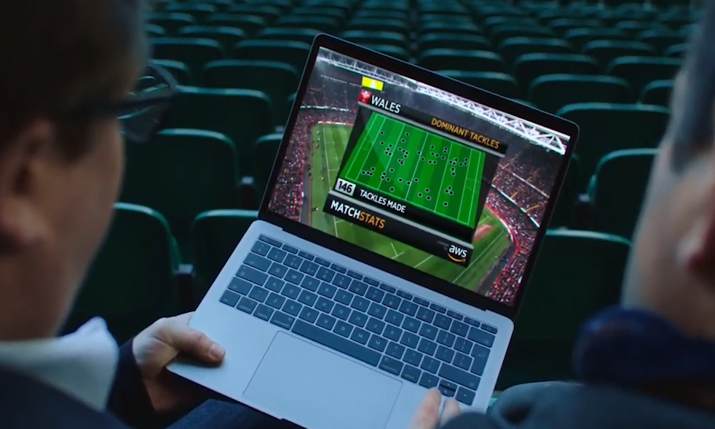
The new stats are: Kick Predictor – showing the probability of a kicker successfully scoring a penalty kick or try conversion; Visits to the 22 – which highlights the number of occasions a team has entered the opposition’s 22 metre area and how many points they have scored with the entries; Ruck and Turnover Locations – a heat map of the pitch to highlight the action areas of each team; Dominant Tackles – which shows the defensive strength and structure of the teams; and Power Game – which shows where a team is dominant, where a team is lacking and potentially where the match is being won or lost.
On what these stats add for fans at home today with little chance of getting into a rugby stadium anytime soon, Carling notes: “I think they’re crucial because they just give real insight into the key areas of rugby. Rugby is quite a complicated sport; it’s quite complex. And I think what the AWS Matchstats have managed to do is almost unpack that a little bit, to say these are some of the crucial areas of the game. [And even though fans] can’t be [in the stadium] at least we can give you an insight into why one of these teams is winning and why this other team is not.”
“Fans at home can suddenly look at and think, ‘ah, okay, those bits are crucial’. It’s not just a lot of stats for stats’ sake”
On how the stats work, Hurst comments: “The Matchstats powered by AWS are generated by gathering live data from the games, ingesting that data into AWS to analyse, and then these insights are delivered back to the live broadcast for viewers in over 170 countries to enjoy. Using advanced AWS cloud technologies, such as machine learning to generate the Kick Predictor insight, the Six Nations Championship can drive deeper analysis of data gathered during the game, providing fans with insights to better understand the split-second decisions made on the field.”
“To break it down further, using cameras on the pitch and broadcast video, AI computer vision and optical tracking senses the players, jersey numbers and the game ball. This generates a series of data points that leverage Amazon EC2, Amazon S3 and Amazon EMR in the capture and storage process. Edge technology, built on AWS, analyses the ingested data which can then uncover formations, playing styles, number of sprints, max speed, distance covered and more. Proprietary machine learning models running on AWS are continually trained using new data to help recognise individual players. Data and insights are then generated and served to teams and broadcasters for live commentary and post-match analysis, as well as fan-facing graphic overlays during matches. What’s more, machine learning models built on Amazon SageMaker are used to generate Matchstats such as Kick Predictor,” states Hurst.
Not stats for stats’ sake
Carling goes onto note that this technology is bringing intelligence to viewers at home: “Before, you’d see data that someone had carried the ball for 40 metres and you think, well, it could be returning a kick; it still might not have got anywhere near the opposition. Whereas now it’s about, has he actually broken the line? Has he broken a defensive line? Who created turnovers? And I think that’s the bit that fans at home can suddenly look at and think, “ah, okay, those bits are crucial”. It’s not just a lot of stats for stats’ sake.”
When people are allowed back into stadiums the stats can continue to enhance the fan’s perspective, says Carling: “I think they will do, because when you’ve got live data being posted all the time it can show on the big boards, [for instance] who’s got the momentum in the game; even when you’re in the stadium, you can probably sense [who has that momentum] but you might not know why. And so you’ll be told, this is why this team is dominating. There are lots of people in stadia who don’t know all of the finer points of [the game] and I think that the match data will just clarify and explain some of that really well.”
Carling adds that AWS Matchstats are particularly interesting for fans that are tuning in to watch their country play during the Six Nations, who may not be avid regular viewers. “On the Six Nations there are lots of sports fans who tune in because Wales are playing Scotland or England are playing Ireland. There’s a great cross-section of match stats, some of which are just very clear and clarify some of the basic points of the game, in terms of why tries are being scored, how they’re being scored, or who’s been the most precise in the scoring zones.”
“The cross-section of all the main stats that have been put together I think actually allow an explanation to new fans, as well as slightly more experienced fans,” Carling concludes.
![]() Sports Graphics Spotlight, sponsored by Vizrt, takes place on Friday 5 March starting at 2pm UK time. It is free-to-attend for sponsors and senior professionals working in the business of European sports broadcasting and production. To find out more and to register go to: Sports Graphics Spotlight
Sports Graphics Spotlight, sponsored by Vizrt, takes place on Friday 5 March starting at 2pm UK time. It is free-to-attend for sponsors and senior professionals working in the business of European sports broadcasting and production. To find out more and to register go to: Sports Graphics Spotlight