

Keep on Moov’ing Part 2: Moov on overcoming the challenges and planning ahead for the London Marathon 2025 and beyond
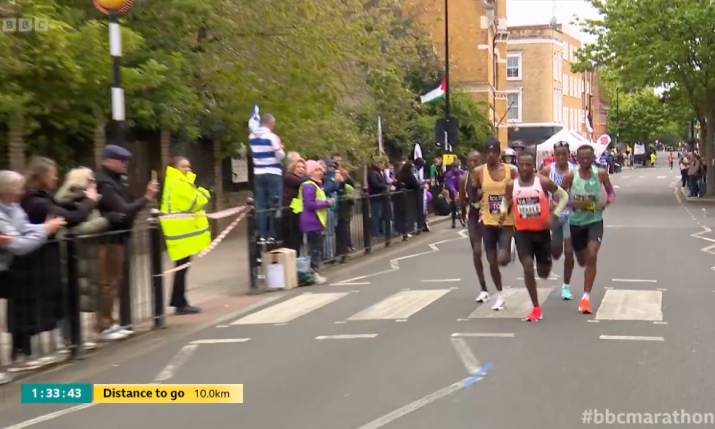
At the 2024 London Marathon, Moov used its graphic prowess with mika:timing’s GPS data to create this graphic of the distance to go in this section of the Elite Men’s race
Moov has just completed its first London Marathon as graphics provider for London Marathon Events. Here, we talk to Laurie Beamont, head of graphics delivery at Moov, about how the company aims to provide more engagement and audience participation through graphics, QR codes, and shout-outs going forwards, and exactly how this year’s marathon went.
So, you have just completed your first ever London Marathon! What are the challenges you face as graphics provider in an event like this?
So a big thing that’s challenging within road races is at the worst of times, the busiest time of the races, you’ve got four races going on in one go, which are the wheelchair men’s, wheelchair women’s, the elite women and the elite men. We’re jumping around races all the time at that point. You may be on one race for a small period and then you might not see it for 20 minutes and then you’re coming back to it. So we need to illustrate ways of updating the audience on what’s happened.
It’s a very, very interesting show to be a part of because logistically it’s a challenge because there’s an OB at the start, there’s an OB at the finish, and then there’s the world feed up in Salford. So you’re in three very different geographical locations. Data services for the internet is a bit tricky in those places and especially when you’ve got tens of thousands of people rocking up on race day, the cell networks go down.
So coordinating the graphics offering can be quite challenging, but it’s important that we do coordinate it; we’re speaking to the person at the start all the time because during the start of the broadcast we’re contributing graphics from two locations on one linear broadcast, which is quite complex, and then obviously the world feed as well, making sure all our data services are all working.
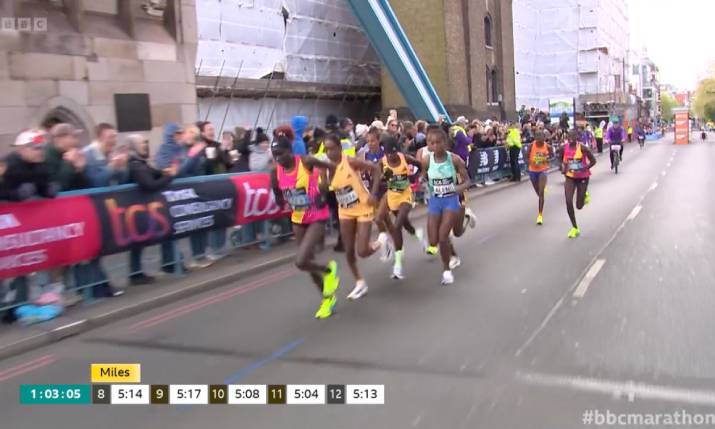
For the London Marathon 2024 Moov created this ‘last miles’ graphic, showing the pace of the runners’ times to show how the pace was increasing and decreasing in the Elite Women’s race, shown here on the BBC
Can you go into more detail on what you did this year and what we’ll see next year?
This year we had the ability to go, “right, let’s show the last five mile times for the elite women”. The elite women was a really important case this year because they were tipped quite early on to break the women’s-only marathon record, which is about two hours 17 minutes, and they did break it in the end, but the whole language about that [for us] was the pace that they were going at.
So we could say, “right, here is the women’s marathon pace,” so we could see the mile times and all of that, but it doesn’t necessarily give you a lot of context within the race; it gives you good context of the group and how they’re going to get to the finish.
Showing a way that a similar device can be demonstrated, the star British athlete, Emile Cairess, was 13th for a while in the men’s race, and it was all about Olympic qualification and those sorts of things. When you look at it on the face value, when you’re at 30 kilometres and he’s in 13th place, you’re like, “oh, it’s done deal for him”. But then his time started to increase versus the people in front of him, so we’ll be looking to compare athlete A and athlete B and how their times have shifted, how they are in relation to the world record, and all of those sorts of things.
We can then see, “this person’s actually moving through the field now and this person’s dropping back,” because that’s the challenge of understanding what’s going on in the race. Because between 30km and 40km he went from 13th to third, and another British athlete was way back as well and ended up finishing fourth.
You have all these stories, and the commentator – who also doesn’t necessarily know that information until they go over that timing split – needs to pick that up a little bit earlier because then that allows us to advise the directors, and go, “hey, this person’s actually increasing his pace, he’s riding through the field, so you might want to dedicate a camera bike to him at this point if you deem that valuable because that’s where the British story is”.
I think that’s also something that is a bit of a challenge between the domestic coverage and the international coverage. Obviously, the BBC are caring solely for the British athletes. But the international feed has to be a bit more agnostic in terms of who it focuses on because it shouldn’t have any bias. I think those sorts of things, athlete comparisons that allow us to illustrate the story, is the headline and what we’ll be trying to achieve next year.
And how did your first London Marathon go?
I think it was positive. We had the race producer come in after the race and said, “hey, we got so much more out than we did in previous years”. So I think all very positive in that respect.
It’s quite an important partnership between ourselves, the timing provider, mika:timing, and BBC Sport, who do a lot of facilities for us, as well as EMG, who provided the OB, and FluidOne, who delivered a lot of the connectivity as well.